
Análisis de resistencia Weibull para los percentiles S-N y su nivel de confiabilidad en test de tensión
DOI:
https://doi.org/10.37636/recit.v5n3e230Palabras clave:
Diseño mecánico, Estrés-resistencia, Distribución Weibull, Análisis de fatiga, Ingeniería de confiabilidadResumen
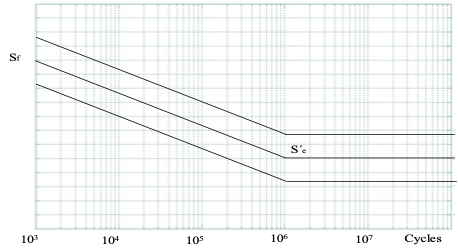
Basado en el estrés verdadero σ_t, la última resistencia del material S_ut, y la curva de fatiga b, la curva S-N de material de acero dúctil es formulada. La distribución Weibull con parámetros β y η son usados para determinar la confiabilidad del elemento y ambos son directamente determinados por la resistencia del material que en este caso corresponde a 103 y 106 ciclos. Y como corresponde en la tabla de propiedades del acero A538 A (b) y recolectada esta información del libro de Ingeniería mecánica de Shigley: los autores presentan el estrés verdadero, ultimo estrés y la curva de diferentes materiales. Entonces los parámetros Weibull β y η, así como los percentiles de confiabilidad 95 y 5 % de la curva S-N son presentados. Se presenta una aplicación paso por paso para el acero A538 A (b). Y basado en el máximo y mínimo estrés aplicado, la distribución Weibull correspondientes es presentada. Por último, basado en el máximo y mínimo estrés, la distribución Weibull correspondiente fue ajustada y usada con la resistencia de la distribución Weibull, en la función estrés-resistencia de confiabilidad con el objeto de estimar la confiabilidad del elemento.
Descargas
Citas
M.R. Piña-Monarrez, “Weibull Stress Distribution for Static Mechanical Stress and its Stress/strength Analysis” Qual Reliab Engng Int. vol. 34, pp. 229–244. 2018. https://doi.org/10.1002/qre.18-0532. DOI: https://doi.org/10.1002/qre.2251
R. Budynas, and J. Nisbett, “Shigley’s Mechanical Engineering Design (Tenth edition)”. New York: McGraw Hill 2015. ISBN: 13-978-0-07-339820-4.
J. Gao, Z. An, and B. Liu, “A new method for obtaining P-S-N curves under the condition of small sample”. Proc IMechE, Part O: J Risk and Reliability vol. 231, no. 2, pp. 130-137. 2017. https://doi.org/10.1177/1748006X16686896. DOI: https://doi.org/10.1177/1748006X16686896
K.B. Rao, M.B. Anoop, G. Rahava, M. Prakash, and A. Rajadurai, “Probabilistic fatigue life analysis of welded steel plate railway bridge girders using S-N curve approach”. Proc IMechE, Part O: J Risk and Reliability vol. 227, no. 4, pp. 385-404. 2013. https://doi.org/10.1177/1748006X13480754. DOI: https://doi.org/10.1177/1748006X13480754
D.B. Kececioglu, “Robust Engineering Design‐By‐Reliability with Emphasis on Mechanical Components and Structural Reliability”. Pennsylvania: DEStech Publications Inc. 2003. ISBN:1-932078-07-X. DOI: https://doi.org/10.4271/2003-01-0141
S.R. Schmid, B.J. Hanrock, and B.O. Jacobson, “Fundamentals of Machine Elements SI Version”, Third Edition. CRC Press, Taylor and Francis Group Boca Raton FL 33487-2742. U.S. A. 2014. ISBN:13:978-1-4822-4750-3.
E. S. Lindquist, “Strength of materials and the Weibull distribution”. Prob. Eng. Mech. Vol. 9, no. 3, pp. 191-194. 1994. https://doi.org/10.1016/0266-8920(94)90004-3 DOI: https://doi.org/10.1016/0266-8920(94)90004-3
H. Rinne, “The Weibull distribution a handbook”, CRC press, Boca Ratón, FL, USA, 2009. ISBN: 13-978-1-4200-8743-7.
W. Weibull, “A statistical theory of the strength of materials”. Proceedings, R Swedish Inst Eng Res vol. 151, no. 45, 1939.
R. Jiang, “A novel parameter estimation method for the Weibull distribution on heavely censorated data”. Proc IMechE, Part O: J Risk and Reliability pp. vol. 236, no. 2, pp. 1-10. 2019. https://doi.org/10.1177/1748006X19887648. DOI: https://doi.org/10.1177/1748006X19887648
M.R. Piña-Monarrez, Weibull Analysis for Normal/Accelerated and Fatigue Random Vibration Test. Qual Reliab Engng Int. vol. 35, no. 7, pp. 2408-2428. 2019. https://doi.org/10.1002/qre.2532. DOI: https://doi.org/10.1002/qre.2532
C.R. Mischke, “A distribution-independent plotting rule for ordered failures”. J. Mech. Des. Vol. 104, pp. 593-597. 1979. https://doi.org/10.1115/1.3256391. DOI: https://doi.org/10.1115/1.3256391
M.R. Piña-Monarrez, J.F. Ortiz-Yañez, “Weibull and Lognormal Taguchi Analysis Using Multiple Linear Regression”. Reliab Eng Syst Saf. Vol. 144, pp. 244–53. 2015. https://doi.org/10.1016/j.ress.2015.08.004. DOI: https://doi.org/10.1016/j.ress.2015.08.004
M.R. Piña-Monarrez, “Conditional Weibull control charts using multiple linear regression”. Qual Reliab Eng Int vol. 33, no. 4, pp. 785‐791. 2016. https://doi.org/10.1002/qre.2056. DOI: https://doi.org/10.1002/qre.2056
E.E. Franz Boehm, and E.E. Lewis. “A stress-strength interference approach to reliability analysis of ceramics: Part I — fast fracture Probabilistic Engineering Mechanics”, vol. 7, no. 1, pp. 1-8. 1992. https://doi.org/10.1016/0266-8920(92)90002-Y. DOI: https://doi.org/10.1016/0266-8920(92)90002-Y
R.L.M. Sales Filho, E. López Droguett, ID. Lins, M.C. Moura, M. Amiri, R.V. Azevedo, “Stress‐strength reliability analysis with extreme values based on q‐exponential distribution”. Qual Reliab Engng Int. vol. 33, no. 3, pp. 457‐477. 2017. https://doi.org/10.1002/qre.2020. DOI: https://doi.org/10.1002/qre.2020
Z.A. Al-Hemyari, “Some estimators for the scale parameter and reliability function of Weibull lifetime data”. Proc IMechE, Part O: J Risk and Reliability. Vol. 224, pp. 197-205. 2010. https://doi.org/10.1243/1748006XJRR299. DOI: https://doi.org/10.1243/1748006XJRR299
A. Kleyner, “Effect of field stress variance n test to field correlation in accelerated reliability demonstration testing”. Qual Reliab Engng Int. vol. 31, no. 5, pp. 783‐788. 2015. https://doi.org/10.1002/qre.1635. DOI: https://doi.org/10.1002/qre.1635
Descargas
Publicado
Cómo citar
Número
Sección
Categorías
Licencia
Derechos de autor 2022 Manuel Baro Tijerina, Manuel Román Piña Monarrez, Jesús Barraza Contreras

Esta obra está bajo una licencia internacional Creative Commons Atribución 4.0.
Los autores/as que publiquen en esta revista aceptan las siguientes condiciones:
- Los autores/as conservan los derechos de autor y ceden a la revista el derecho de la primera publicación, con el trabajo registrado con la licencia de atribución de Creative Commons 4.0, que permite a terceros utilizar lo publicado siempre que mencionen la autoría del trabajo y a la primera publicación en esta revista.
- Los autores/as pueden realizar otros acuerdos contractuales independientes y adicionales para la distribución no exclusiva de la versión del artículo publicado en esta revista (p. ej., incluirlo en un repositorio institucional o publicarlo en un libro) siempre que indiquen claramente que el trabajo se publicó por primera vez en esta revista.
- Se permite y recomienda a los autores/as a compartir su trabajo en línea (por ejemplo: en repositorios institucionales o páginas web personales) antes y durante el proceso de envío del manuscrito, ya que puede conducir a intercambios productivos, a una mayor y más rápida citación del trabajo publicado (vea The Effect of Open Access).


